Request a Quote

Interested in purchasing the Cedars-Sinai Cardiac Suite?

• Fill out a Quote Request

• Call +1-844-CSMC-AIM
  (844-276-2246), press 1 for Sales

• Email sales@csaim.com

Visit the Suite 2017 page for information about the latest version of Cardiac Suite.


Cedars-Sinai Cardiac Suite 2015

Version 2015 of the Cardiac Suite brings a host of new features and improvements. Here are some that you might be interested in.

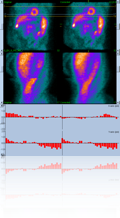
Image Quality Control Tools

A new page is now available in QGS+QPS and QBS. The Quality page allows you to assess your data for acquisition issues. Sinograms, linograms, and count graphs (per projection and per interval) quickly alert you of problems such as gating errors and patient motion that may lead to incorrect image interpretation.

Smart Defect Editor

Sometimes a study appears normal by all measures, but quantitative analysis reports a small defect. You know this defect is an artifact, because you have knowledge of this patient that no program can replicate. The smart defect editor allows you to manually modify (edit, add, or remove) defect regions to match your vision. This way, you never have to report a study as normal with polar map defects or non-zero scores or TPD. You can also edit defects to better match knowledge of specific coronary territories.

Configurable Data Selector

We've made it easier than ever to select datasets according to your workflow and your preferences. Do you like to compare attenuation-corrected and non-corrected images? You can set that up to be the default. Do you perform prone acquisitions? Easy to configure. Do you have different preferences for different pages? No problem. More than ever, QGS+QPS works the way you do.

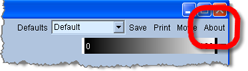
Color Palette Import / Export

We know that everyone has their own preferences when it comes to color scale selection. You can now import and export color palette files to improve consistency across platforms. We support several common color scale formats.

Reporting

Our automated report generator, ARG, has received a lot of attention in preparation for the wide availability of the ASNC ImageGuide Registry. The final specification for data transfers to the registry is not yet available at the time of this writing (March 19, 2015, updated July 2, 2015), but ARG will be ready as soon as this information is finalized. In addition, ARG also got administrative reports for department managers, custom fields, and a centralized distribution server available as a Windows service for improved delivery of reports and data to other systems.

There's more!

Suite 2015 also includes a number of algorithm improvements, new display options, and fixes for common little annoyances.

And let's not forget the improvements we brought in past years

Single QGS+QPS application with TID and LHR, group processing, multi-monitor support, enhanced motion/thickening limits, CFR and MBF, automatic registration, native OS X support, to list but a few.

System requirements

Cedars-Sinai Cardiac Suite 2015 supports Windows 7 and later (7, 8, 8.1, and soon 10), and Macs running OS X 10.8 (Mountain Lion), 10.9 (Mavericks), and 10.10 (Yosemite).


UNUSED1

UNUSED2    Close

Individual applications (QGS, QPS, QBS)

You can find your version number in the "about..." box. Click the About button in the upper right corner of the application.

If using the combined QGS+QPS or AutoQUANT™, the About button is located at the bottom of any of the color scale controls.

AutoQUANT™ users, please see the conversion chart to see which CSMC Cardiac Suite version corresponds to your AutoQUANT™ version.

CSimport

In CSimport (aka CSI), the "about..." box can be displayed from the Help menu in the usual manner.

QGS+QPS and AutoQUANT™

What is the PlusPack module?

PlusPack groups several useful, advanced quantitative and productivity features in one bundle. These features are:

  • Motion frozen: compensate for cardiac motion to generate sharper perfusion datasets
  • Serial change assessment: directly compare serial studies, bypassing comparisons to statistical databases
  • Prone/Supine SPECT perfusion quantification: help eliminate artifacts by merging information from both acquisition positions
  • Shape index calculation: quantify ventricular remodeling, an early marker of disease
  • Phase analysis: assess mechanical dyssynchrony using powerful quantitative and visual tools
  • Powerpoint export: launch the Cardiac Suite from within Microsoft Powerpoint® for enhanced, more interactive presentations

Click here to open a new page with video tutorials about these features.

Basic Perfusion SPECT Bundle

This bundle includes the following applications and features:

QGS - Quantitative Gated SPECT
This application provides cardiac function quantitation using perfusion datasets: ED and ES volumes, ejection fraction. The image data can be viewed in a variety of modes, from selected slices in a 2D view to a rendered 3D surface of the myocardium with function maps (perfusion, motion, thickening and regional EF).
QPS - Quantitative Perfusion SPECT
In addition to cardiac parameters, such as chamber volume and wall area, this application provides perfusion analysis of ungated datasets by comparing rest and stress datasets to a database of normal values (also called normal limits) using statistical methods.
This bundle also includes the CSI data management application and the Companion module (AHA 17-segment scoring, diastolic function, eccentricity).

Basic Perfusion + Blood Pool SPECT Bundle

This bundle includes the following applications and features:

QGS - Quantitative Gated SPECT
This application provides cardiac function quantitation using perfusion datasets: ED and ES volumes, ejection fraction. The image data can be viewed in a variety of modes, from selected slices in a 2D view to a rendered 3D surface of the myocardium with function maps (perfusion, motion, thickening and regional EF).
QPS - Quantitative Perfusion SPECT
In addition to cardiac parameters, such as chamber volume and wall area, this application provides perfusion analysis of ungated datasets by comparing rest and stress datasets to a database of normal values (also called normal limits) using statistical methods.
QBS - Quantitative Blood Pool SPECT
This application provides automatic quantitation of left- and right-ventricular function (ejection fraction, ED and ES volumes, stroke volumes) using gated blood pool SPECT images. It also displays motion polar maps and parametric surfaces.
This bundle also includes the CSI data management application and the Companion module (AHA 17-segment scoring, diastolic function, eccentricity).

Deluxe Perfusion SPECT Bundle

This bundle includes the following applications and features:

QGS - Quantitative Gated SPECT
This application provides cardiac function quantitation using perfusion datasets: ED and ES volumes, ejection fraction. The image data can be viewed in a variety of modes, from selected slices in a 2D view to a rendered 3D surface of the myocardium with function maps (perfusion, motion, thickening and regional EF).
QPS - Quantitative Perfusion SPECT
In addition to cardiac parameters, such as chamber volume and wall area, this application provides perfusion analysis of ungated datasets by comparing rest and stress datasets to a database of normal values (also called normal limits) using statistical methods.
Compared to the Basic Perfusion SPECT bundle, this package adds the PlusPack module, providing serial change assessment, prone/supine perfusion quantification, shape index calculation, phase analysis, and powerpoint export.
This bundle also includes the CSI data management application and the Companion module (AHA 17-segment scoring, diastolic function, eccentricity).

Deluxe Perfusion + Blood Pool SPECT Bundle

This bundle includes the following applications and features:

QGS - Quantitative Gated SPECT
This application provides cardiac function quantitation using perfusion datasets: ED and ES volumes, ejection fraction. The image data can be viewed in a variety of modes, from selected slices in a 2D view to a rendered 3D surface of the myocardium with function maps (perfusion, motion, thickening and regional EF).
QPS - Quantitative Perfusion SPECT
In addition to cardiac parameters, such as chamber volume and wall area, this application provides perfusion analysis of ungated datasets by comparing rest and stress datasets to a database of normal values (also called normal limits) using statistical methods.
QBS - Quantitative Blood Pool SPECT
This application provides automatic quantitation of left- and right-ventricular function (ejection fraction, ED and ES volumes, stroke volumes) using gated blood pool SPECT images. It also displays motion polar maps and parametric surfaces.
Compared to the Basic Perfusion + Blood Pool SPECT bundle, this package adds the PlusPack module, providing serial change assessment, prone/supine perfusion quantification, shape index calculation, phase analysis, and powerpoint export.
This bundle also includes the CSI data management application and the Companion module (AHA 17-segment scoring, diastolic function, eccentricity).

Deluxe Perfusion PET Bundle

This bundle includes the following applications and features:

QGS-PET - Quantitative Gated PET
This application provides cardiac function quantitation using perfusion datasets: ED and ES volumes, ejection fraction. The image data can be viewed in a variety of modes, from selected slices in a 2D view to a rendered 3D surface of the myocardium with function maps (perfusion, motion, thickening and regional EF).
QPET - Quantitative PET
The new PET Kinetics module provides the calculation of Coronary Flow Reserve (CFR) and Myocardial Blood Flow (MBF).
This application also provides automatic segmentation, quantification and analysis of static and gated myocardial perfusion PET, with support for both short axis and transverse datasets.
This bundle is designed for the processing of PET data only and can be purchased at a substantial discount with a SPECT bundle for a complete PET/SPECT processing solution.
This bundle also includes the CSI data management application, the PlusPack module (serial change assessment, prone/supine perfusion quantification, shape index calculation, phase analysis, powerpoint export), the Fusion/CT module (3D display and automatic registration of coronary trees, fused image display), and the Companion module (AHA 17-segment scoring, diastolic function, eccentricity).

The Automated Report Generator (ARG) Add-On

ARG - Automated Report Generator
The Cedars-Sinai reporting system can substantially improve the workflow in your nuclear cardiology department. Its two components are Automated Report Generator (ARG) and QARG.
This add-on provides a reporting server, integration with QPS and QGS, as well as the standalone data entry tool QARG that can be used in the stress lab or anywhere else to enter patient demographics, ECG info, etc...

Automated Reconstruction (AutoRecon) Add-On

AutoRecon
This application offers several automatic processing modules for single-photon emission computed tomography (SPECT) studies.

This add-on provides a full-fledged reconstruction program with the following features:

  • automated reconstruction limits selection
  • automated motion correction
  • filtered backprojection and iterative reconstruction.
  • automatic reorientation of the transaxial data into short axis images

Breathe new life into your old camera by freeing yourself from antiquated workstations!

Motion Correction (MoCo) Add-On

MoCo - Motion Correction
This application provides automatic and manual correction of SPECT acquisition artifacts.

A cost effective solution to benefit from motion correction while using your workstation's reconstruction software.

What is in the Companion module?

The Companion includes several useful features that were added after the initial release of the quantitative cardiac suite. These features are:

  • AHA model 17-segment scoring
  • Eccentricity calculation: a measure of ventricular sphericity to assess ventricular remodeling
  • Diastolic function: ventricular filling and emptying parameters are extracted from interpolated time-volume curves

What is the Fusion/CT module?

The Fusion/CT module adds features related to coronary CT angiography (CTA) and multi-modality registration. These features are:

  • 3D display of coronary trees extracted by a variety of software packages
  • Automated registration of coronary trees (especially useful for non-hybrid systems)
  • Fused image display to assess or correct image registration (for CTA and attenuation CT data)

The Fusion/CT module is standard with the Deluxe PET bundle, and available as an option for SPECT bundles.

What is the CSI data browser?

Our software packages are designed to be installed on your computer, not on vendor workstations. To use the quantitative applications studies need to be transferred from your acquisition systems to your computer with the Cedars-Sinai software.

CSI allows you to transfer studies and manages the datasets on your computer. Its main features include:

  • Pull data from DICOM Query/Retrieve and FTP servers as well as legacy systems
  • Push data from DICOM systems to your computer
  • Import data from CDs or other removable media, or from a network share
  • Simple, intuitive data management lets you organize data in folders to manage clinical and research projects
  • One-click anonymized mode hides patient identification so you can use the software in interactive lectures

Click here to open a new page with video tutorials about some of these features.